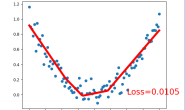
运行结果

代码如下:
"""
Know more, visit my Python tutorial page: https://morvanzhou.github.io/tutorials/
My Youtube Channel: https://www.youtube.com/user/MorvanZhou
Dependencies:
tensorflow: 1.1.0
matplotlib
numpy
"""
import tensorflow as tf
import matplotlib.pyplot as plt
import numpy as np

tf.set_random_seed(1)   #seed值一样生成的随机数不一样,单属于通遇阻
   https://blog.csdn.net/hongxue8888/article/details/79955982
    np.random.seed(1)    #seed值一样后面生成的随机数就一样
#https://blog.csdn.net/jiangjiang_jian/article/details/79031788
    # fake data
    x = np.linspace(-1, 1, 100)[:, np.newaxis]             # shape (100, 1)       #https://blog.csdn.net/you_are_my_dream/article/details/53493752
    #https://blog.csdn.net/you_are_my_dream/article/details/53493752

noise = np.random.normal(0, 0.1, size=x.shape)
y = np.power(x, 2) + noise                          # shape (100, 1) + some noise

# plot data
plt.scatter(x, y)  #输出的是点
plt.show()  #显示点云

tf_x = tf.placeholder(tf.float32, x.shape)     # input x    设置输入变量占位符
tf_y = tf.placeholder(tf.float32, y.shape)     # input y

    # neural network layers
   https://blog.csdn.net/o0haidee0o/article/details/80514388
    l1 = tf.layers.dense(tf_x, 10, tf.nn.relu)          # hidden layer   相当于add_layer()
    output = tf.layers.dense(l1, 1)                     # output layer
https://www.w3cschool.cn/tensorflow_python/tensorflow_python-zkxr2x87.html
loss = tf.losses.mean_squared_error(tf_y, output)   # compute cost
optimizer = tf.train.GradientDescentOptimizer(learning_rate=0.5)#选择优化器,逆向传递函数
train_op = optimizer.minimize(loss)

sess = tf.Session()                                 # control training and others
sess.run(tf.global_variables_initializer())         # initialize var in graph

plt.ion()   # something about plotting 打开交互界面,连续显示图像
#上面只是定义了一些变量,下面才是重头戏,开始运行
for step in range(100):
    # train and net output
    _, l, pred = sess.run([train_op, loss, output], {tf_x: x, tf_y: y})  #前面表示需要运行的公式,后面表示可以提供的数据
    if step % 5 == 0:
        # plot and show learning process
        plt.cla()    #清除matplotlib
        plt.scatter(x, y)  #散点图
        plt.plot(x, pred, 'r-', lw=5)  #绘制折线图
        plt.text(0.5, 0, 'Loss=%.4f' % l, fontdict={'size': 20, 'color': 'red'}) #在街面上的固定位置进行文字说明
        plt.pause(0.1)  #运行一次plot的连续界面暂停的时间

plt.ioff()  #关闭交互式界面
plt.show()


